

Dashboard Overview & Analytics
Dashboard Overview & Analytics shows an overview of chatbot performance, user interactions, and customer feedback. This guide helps you navigate and interpret essential metrics to successfully optimize the operation of your chatbot.
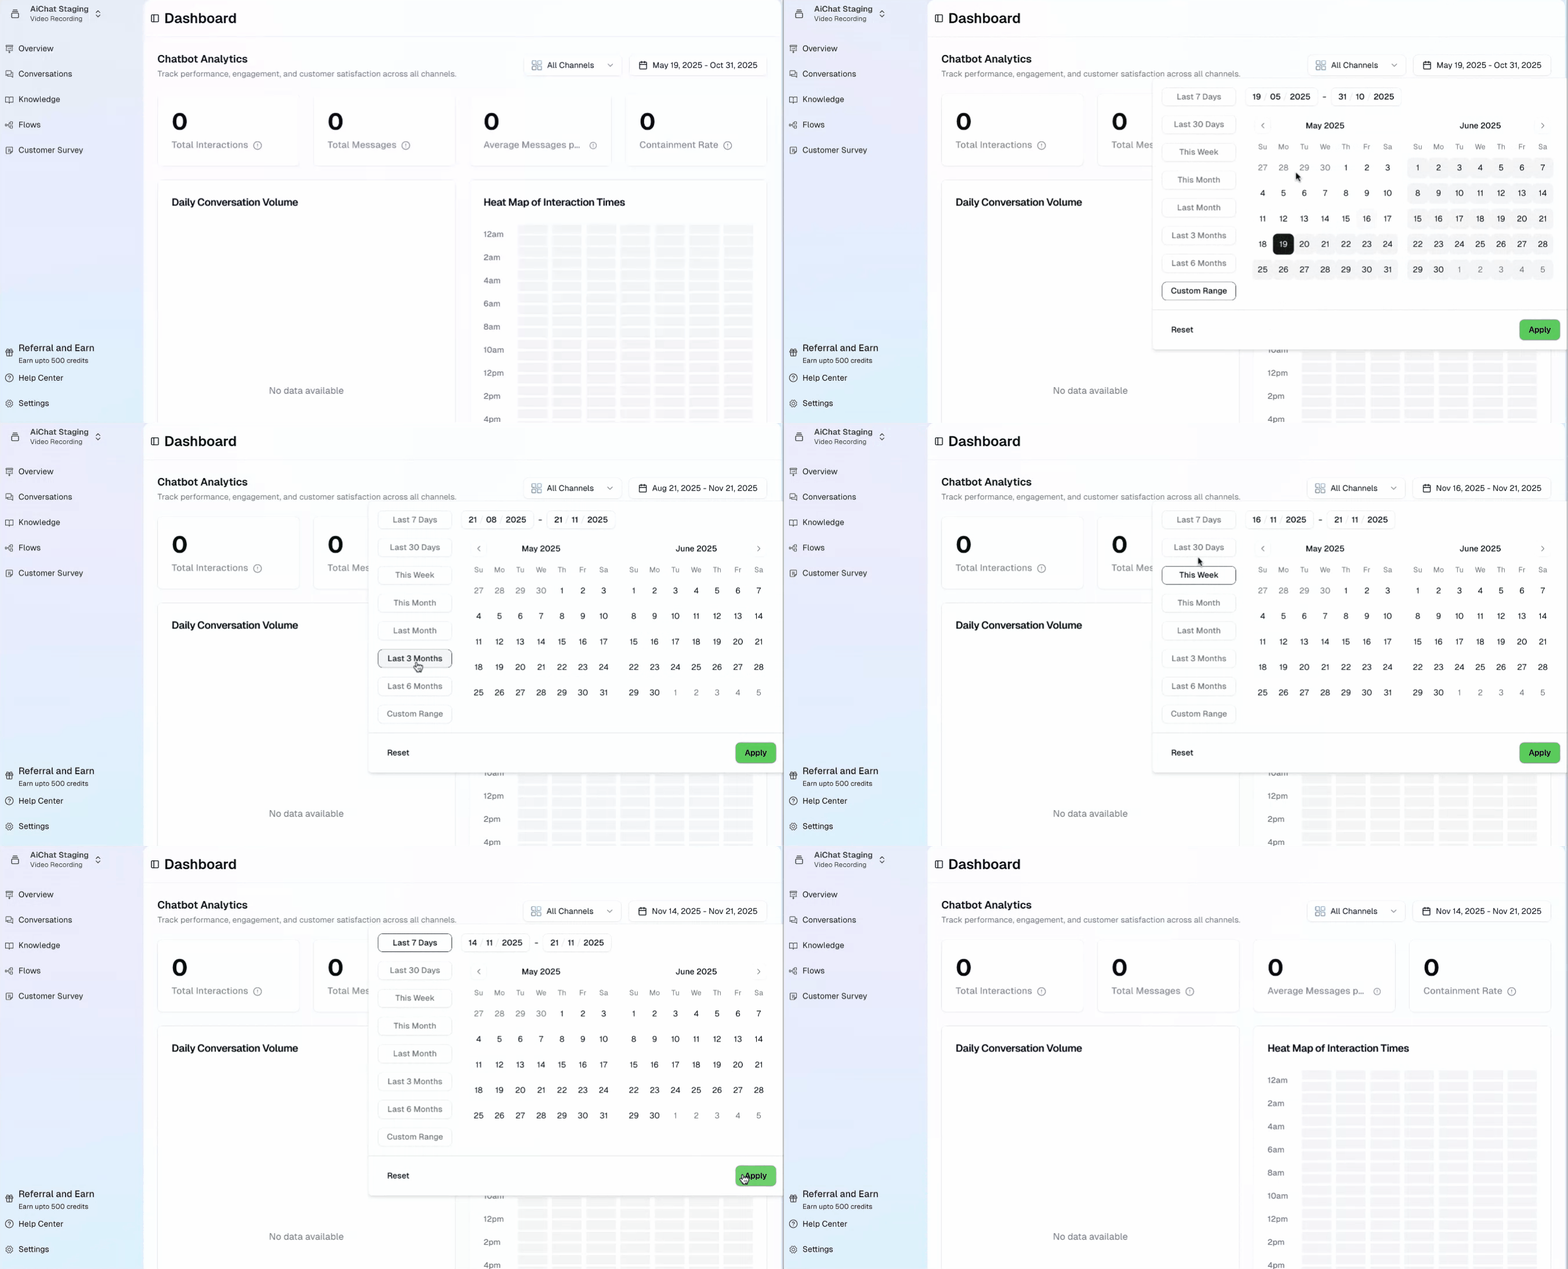
1. Chatbot Analytics: Viewing Performance Data
This section focuses on core chatbot performance and interaction volume within a specified time frame.
Steps to View Data:
- Select Date Range: Choose a predefined option (e.g., Last 7 Days, This Month) or set a custom range by selecting start and end dates from the calendar.
- Select Channels: Choose specific channels to narrow down the data you wish to view.
- Apply: Click the Apply button to update the dashboard with your selections.
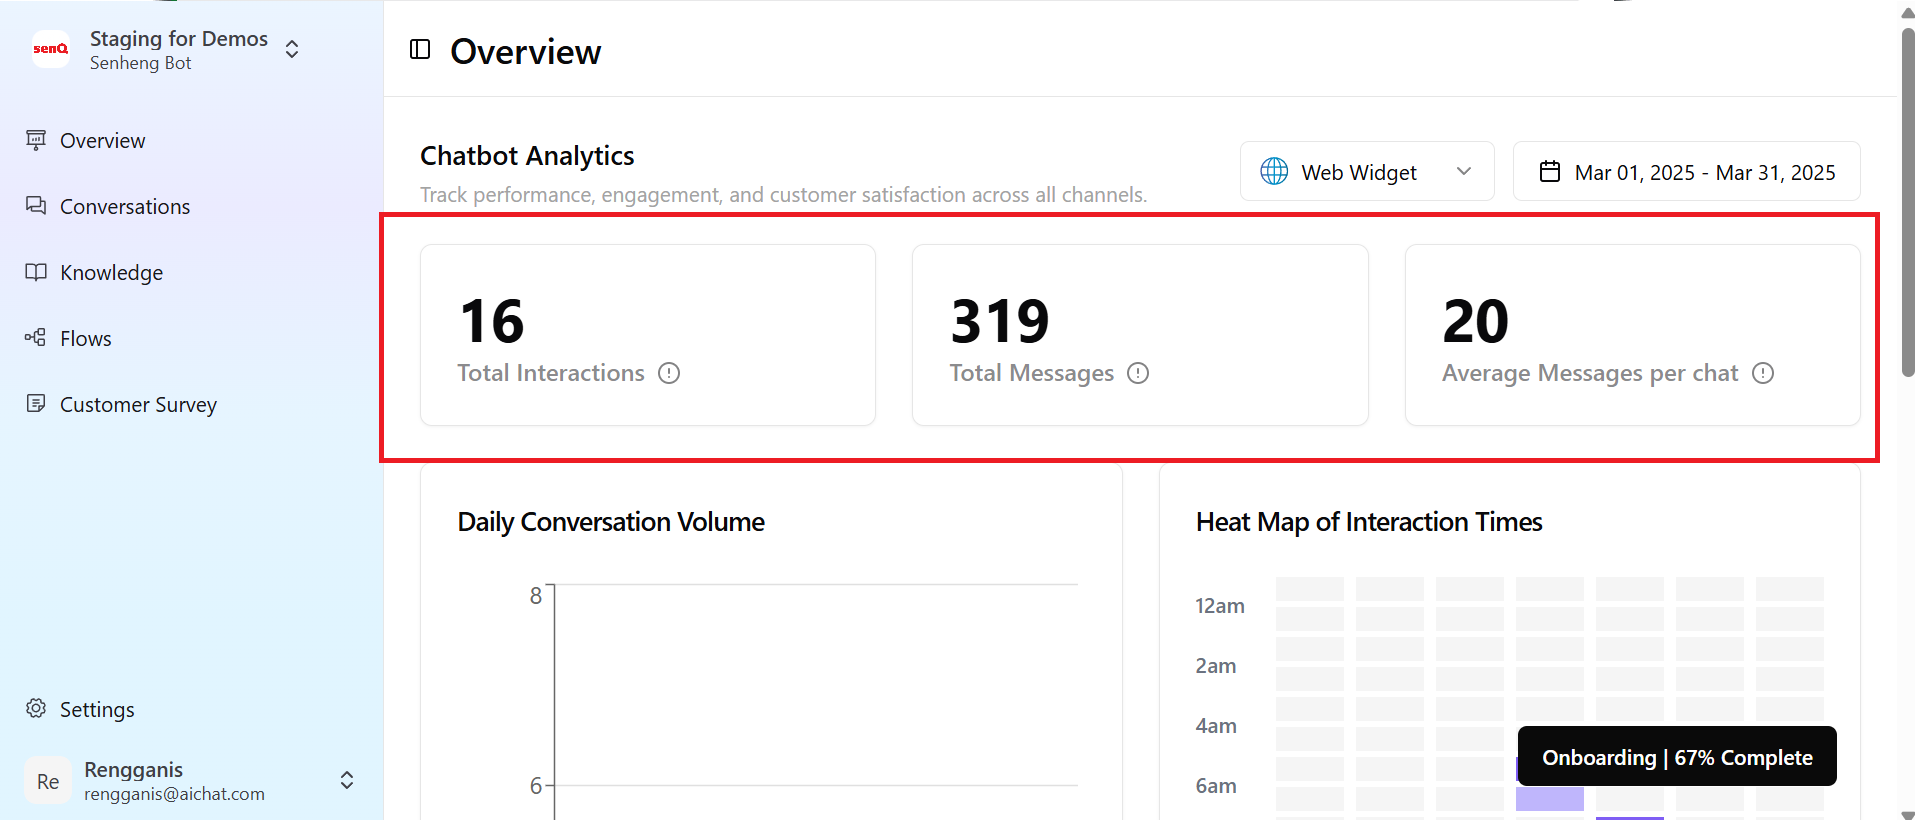
3 Key Metrics to Monitor:
- Total Interactions: The total number of conversations handled by the chatbot during the selected period.
- Total Messages: The total number of messages sent and received, which indicates how engaging the chatbot is. This can be viewed daily or monthly.
- Average Messages per Chat: A measure of the average length of a conversation, indicating chat depth.
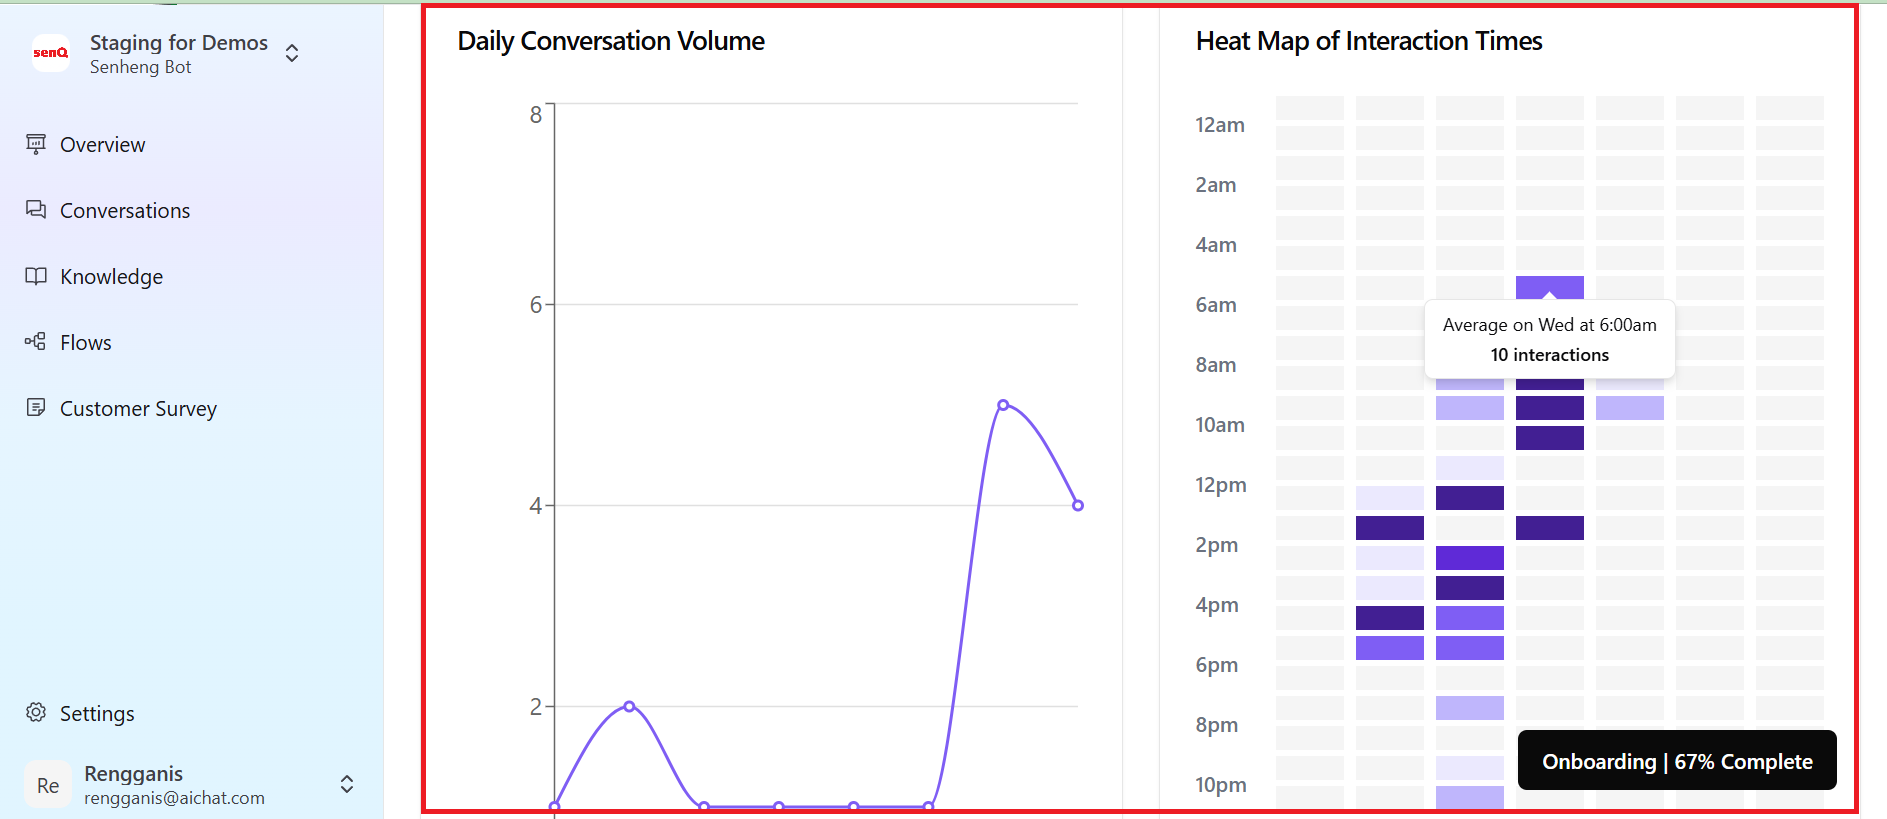
2. Daily Conversation Volume & Heat Map
This visual section helps you identify peak usage times.
- Heat Map of Interaction Times: Shows what the busiest hours of your chatbot are.
- Daily Conversation Volume: A line chart that displays the number of interactions on a daily basis.
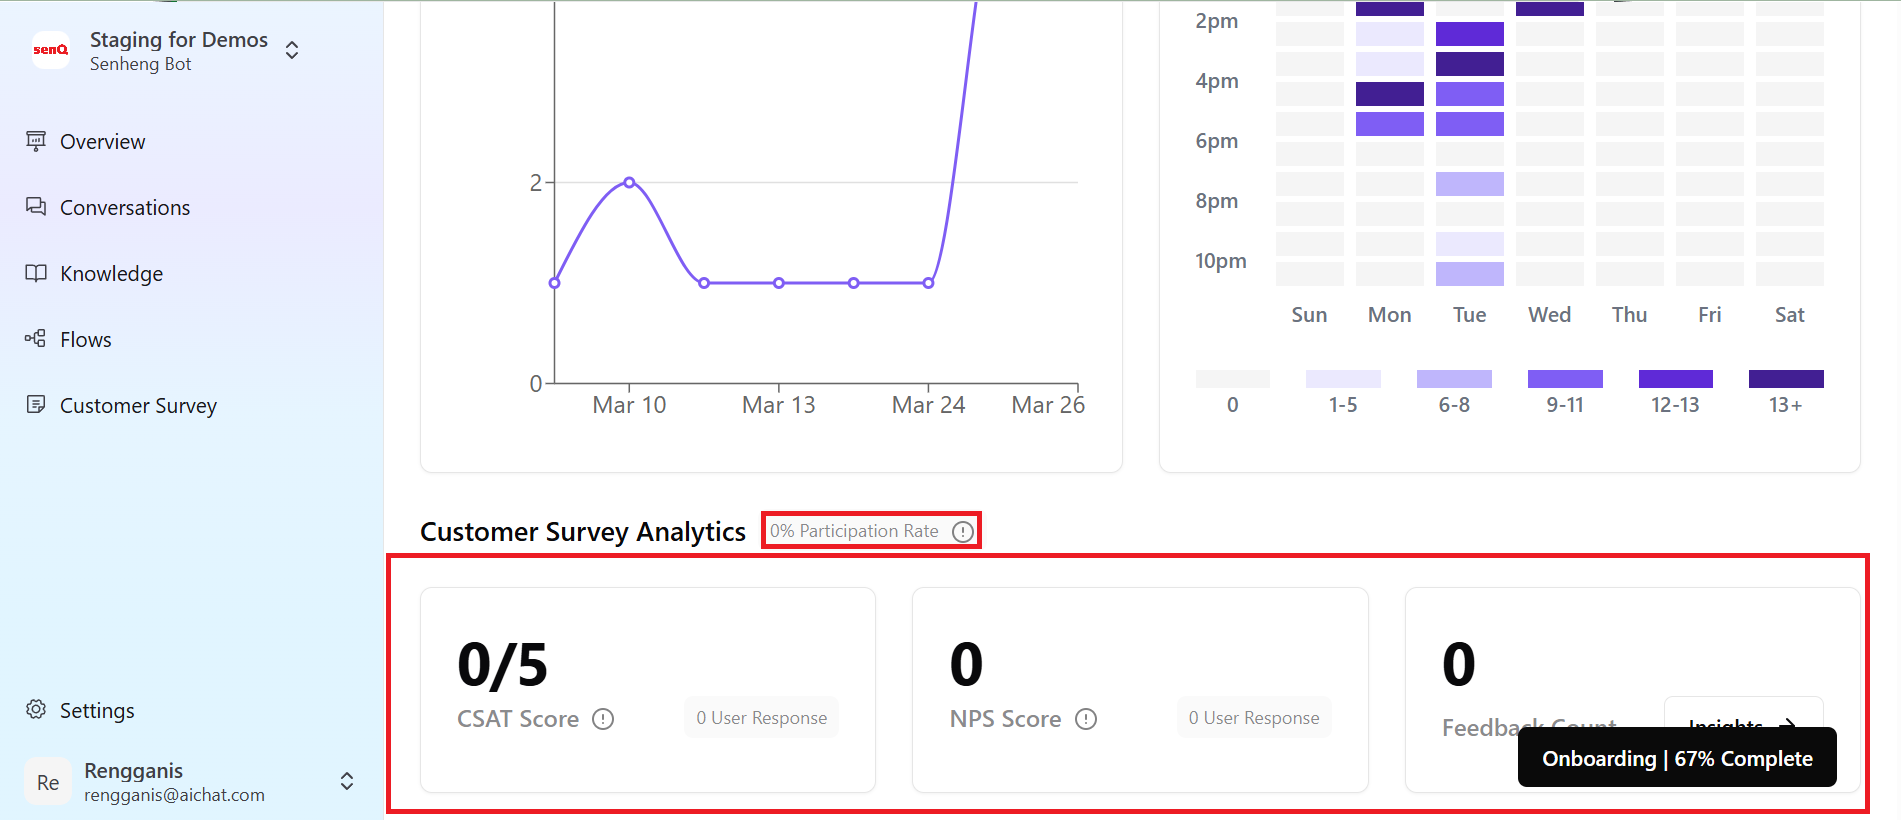
Customer Survey Analytics
This section gives an insight into customers and their satisfaction.
Key Metrics to Monitor:
- CSAT Score (Customer Satisfaction Score): Measures user contentment with chatbot responses on a satisfaction scale of 1 to 5. The score is calculated as the total cumulative ratings divided by the total number of responses.
- NPS Score (Net Promoter Score): Indicates customer loyalty. A positive number closer to 100 is ideal. The score is calculated as the difference between the total percentage of users giving a thumbs-up (👍) minus the total percentage of users giving a thumbs-down (👎).
- User Survey Feedback Count: The total number of user responses received through the surveys.
- Rate of Participation: The percentage of users who interacted with the chatbot and subsequently provided feedback.
Best Practices for Dashboard Monitoring
Do a weekly or monthly review schedule to monitor trends in the dashboard.
Compare historical data to identify long-term patterns and improvement areas.
Adjust chatbot responses, workflows, and escalation rules based on data insights.
Monitor analytics to determine if adjustments boost engagement and satisfaction.